
Earnings season is one of the most closely watched periods on Wall Street.
Every quarter, investors analyze revenue, earnings per share, and forward guidance to determine whether companies are meeting expectations. While those reports are certainly important, professional traders know that the broader market often tells a bigger story.
Instead of focusing on individual earnings reports alone, experienced traders monitor several key market indicators to better understand investor sentiment and identify potential opportunities.
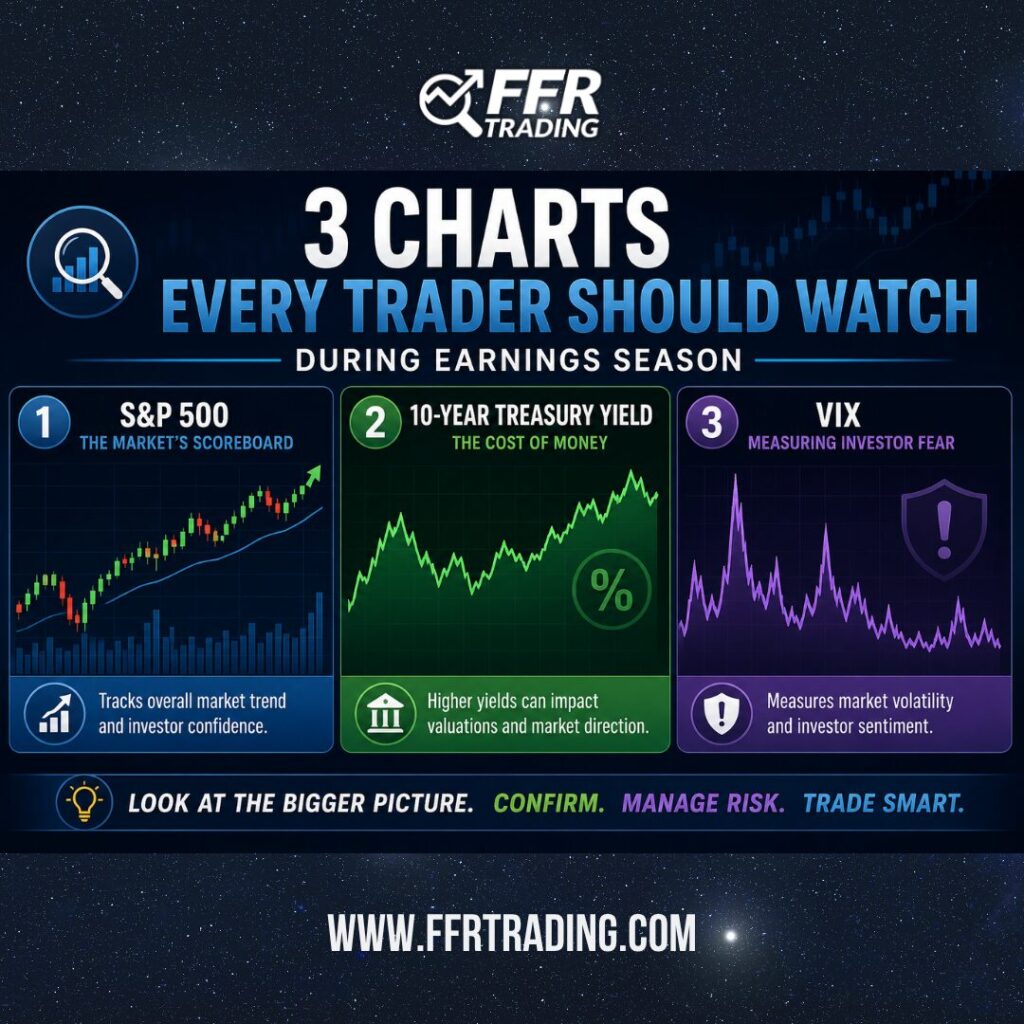
Here are three charts worth watching during earnings season.
1. The S&P 500 – The Market’s Scoreboard
The S&P 500 serves as one of the best gauges of overall market sentiment.
While individual companies may deliver impressive earnings, it’s the market’s reaction that often reveals how investors truly feel.
Ask yourself:
- Is the S&P 500 making higher highs and higher lows?
- Are buyers stepping in after pullbacks?
- Is the broader trend still intact?
If the index continues to trend higher despite mixed earnings reports, it suggests investors remain confident in the overall market.
On the other hand, if strong earnings fail to lift the index, it may signal that expectations have become too optimistic.
2. The 10-Year Treasury Yield – The Cost of Money
Many investors focus exclusively on stocks while overlooking one of the market’s most influential indicators—the 10-Year Treasury Yield.
Higher Treasury yields increase borrowing costs for businesses and consumers while making bonds more attractive relative to stocks.
During earnings season, rising yields can pressure highly valued growth companies, particularly those in the technology sector.
When monitoring the 10-year yield, ask:
- Are yields trending higher or lower?
- How are growth stocks reacting?
- Is the bond market confirming or contradicting the stock market?
Understanding the relationship between interest rates and equity valuations can provide valuable context during periods of heightened volatility.
3. The VIX – Measuring Investor Fear
The CBOE Volatility Index (VIX) is often called Wall Street’s “fear gauge.”
Rather than measuring stock prices directly, the VIX reflects expectations for future market volatility based on options pricing.
During earnings season, a rising VIX can signal increasing uncertainty as investors prepare for major corporate announcements.
A declining VIX, on the other hand, often suggests confidence is returning to the market.
Keep an eye on whether:
- The VIX is rising while stocks are falling.
- The VIX is declining as markets rally.
- Volatility remains elevated even after earnings are released.
These clues can help traders better understand the market’s overall mood.
The Bigger Picture
Professional traders rarely make decisions based on a single chart.
Instead, they look for confirmation from multiple areas of the market.
For example:
- A rising S&P 500
- Stable or declining Treasury yields
- A falling VIX
Together, these signals often suggest improving investor confidence.
Conversely, if the S&P 500 struggles while Treasury yields rise and the VIX climbs, traders may become more defensive until conditions improve.
Looking at these indicators together provides a more complete picture than focusing on individual earnings reports alone.
Final Thoughts
Earnings season creates excitement, but successful traders know that understanding the broader market is just as important as analyzing individual companies.
The next time earnings dominate the headlines, remember to look beyond the charts of individual stocks.
Watch the S&P 500 to gauge overall market direction.
Monitor the 10-Year Treasury Yield to understand how interest rates may be influencing valuations.
And keep an eye on the VIX to measure investor sentiment and potential market volatility.
Together, these three charts can provide valuable context and help you make more informed trading decisions.
At FFR Trading, we believe education and preparation are essential to long-term success. Learning to interpret the broader market—not just individual stock charts—is one way traders can develop greater confidence and discipline.