Markets don’t move the same amount every day.
Some sessions are quiet. Others produce large price swings in a matter of minutes.
So how can traders tell when volatility is increasing or decreasing?
One popular tool is Average True Range, or ATR.
What Is Average True Range?
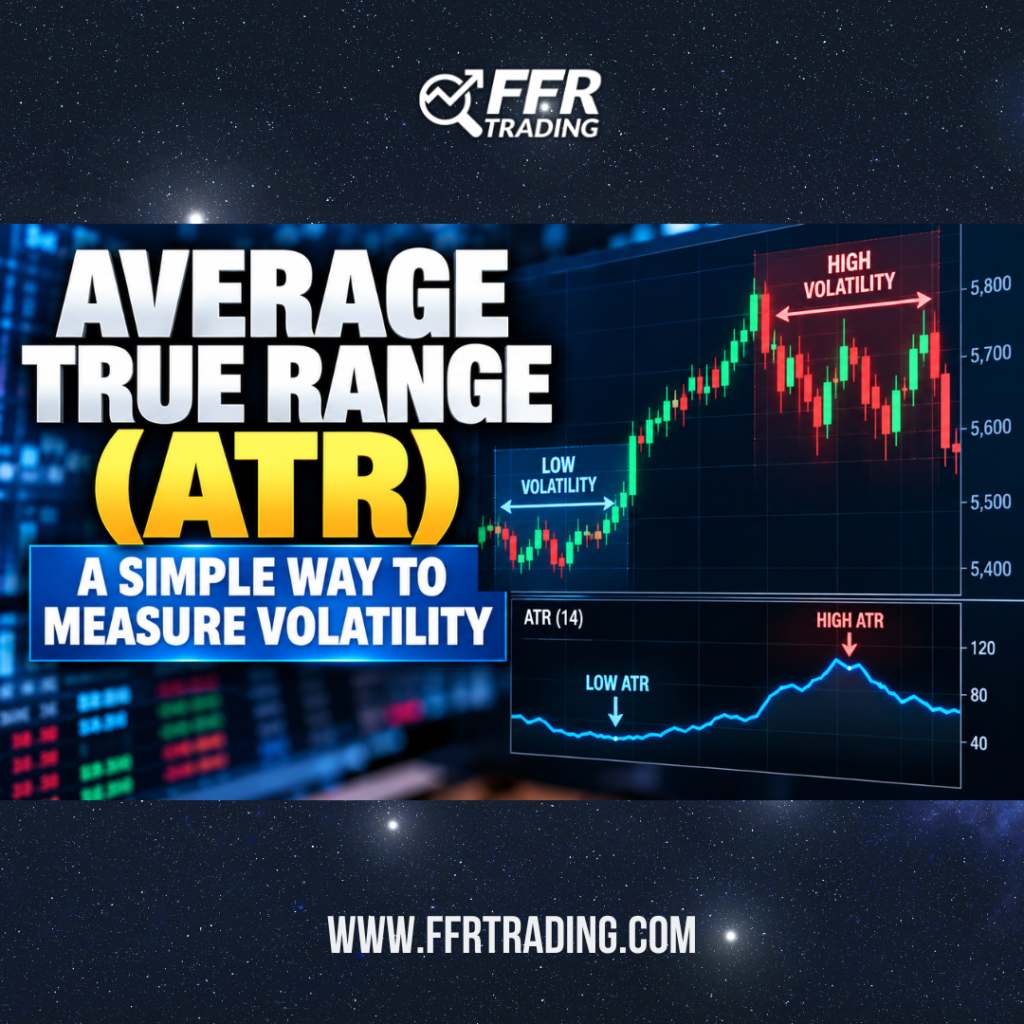
ATR is a technical indicator designed to measure how much an investment typically moves over a certain period.
A rising ATR generally means price swings are getting larger.
A falling ATR means trading ranges are becoming smaller.
The important thing to remember is:
ATR measures volatility—not direction.
A rising ATR doesn’t tell you whether a stock is bullish or bearish. It simply tells you that price movement is expanding.
Why Does ATR Matter?
Suppose a stock normally moves about $1 per day.
A trader using a 25-cent stop might be giving the position very little room to move.
But if that same stock typically moves only 30 cents per day, a 25-cent stop means something very different.
ATR gives traders context.
It can help answer questions such as:
- Is today’s move unusually large?
- Has volatility increased?
- Is my stop too close for current conditions?
- Does my profit target make sense?
- Should I consider reducing my position size?
ATR and Risk Management
This is where ATR can become particularly useful.
When volatility increases, the distance needed to give a trade reasonable room may also increase.
But wider stops can mean greater risk.
Instead of simply accepting more risk, a trader might compensate by reducing position size.
That’s an important concept:
As volatility increases, position size may need to decrease to keep risk under control.
Don’t Use ATR in Isolation
Like any indicator, ATR shouldn’t make trading decisions for you.
It doesn’t identify whether a market is overvalued, tell you where prices will go next or guarantee that a particular stop will hold.
Instead, think of ATR as another piece of evidence.
Combine it with support and resistance, volume, price action and broader market conditions.
The Bottom Line
Markets constantly move between periods of lower and higher volatility.
ATR gives traders a simple way to recognize those changes.
Rather than asking only:
“Is the market going up or down?”
Consider asking:
“How much is this market moving right now?”
Understanding volatility can help traders make better decisions about risk, position size, stops and expectations.
💡 FFR Trader’s Tip
Don’t assume yesterday’s risk parameters automatically fit today’s market.
When volatility changes, your risk may need to change with it.
Trading and investing involve substantial risk. No technical indicator guarantees profitable results. Past performance is not indicative of future results.