The SPY new high is giving traders another reason to stay focused on the strength of the current market rally.
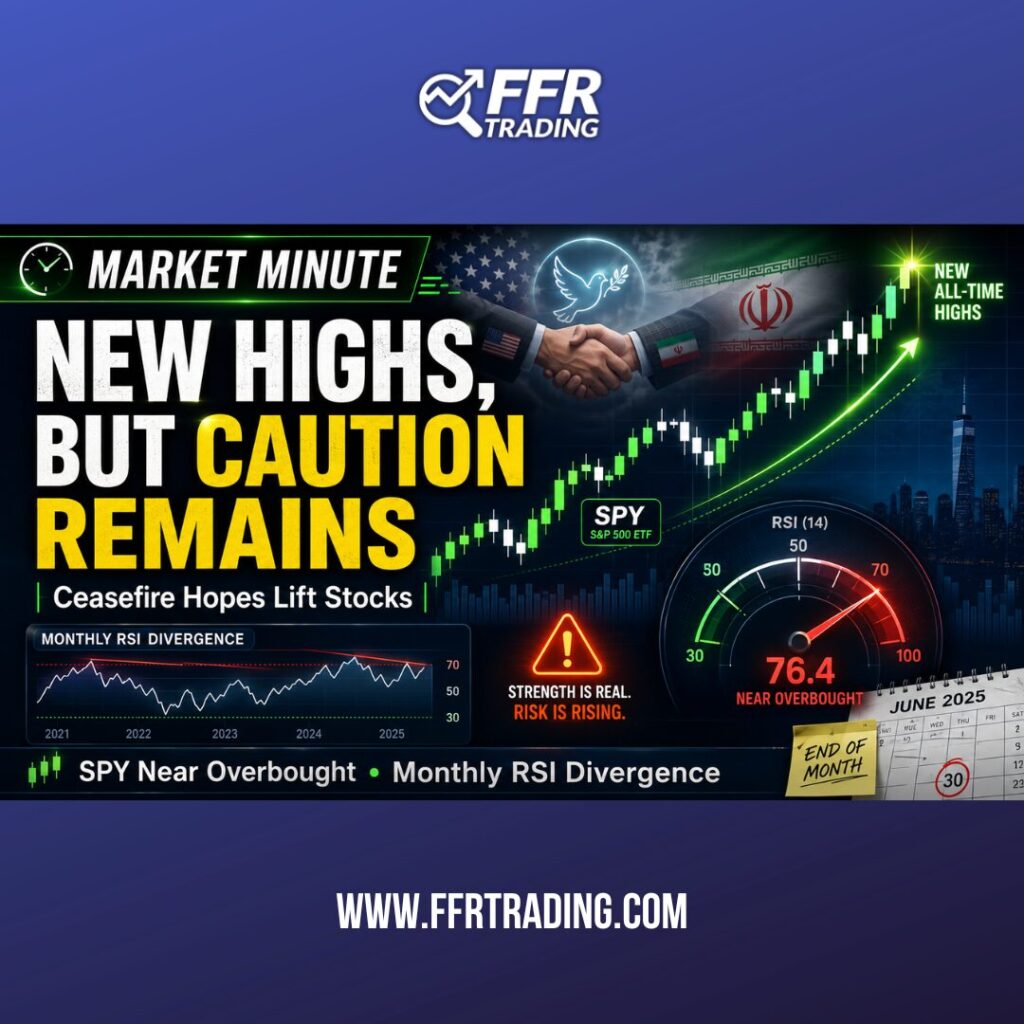
The SPDR S&P 500 ETF Trust recently pushed to another new all-time high as investors responded positively to the possibility of an extended ceasefire agreement between the U.S. and Iran.
That optimism helped fuel another wave of buying, keeping the broader bullish trend intact and reinforcing the idea that investors are still willing to step into equities when risk sentiment improves.
But while new highs are encouraging, traders should not ignore what the charts are saying.
The Bullish Trend Remains Intact
From a trend perspective, the market continues to look strong.
When SPY pushes into new high territory, it often reflects strong institutional demand, improving investor confidence, and continued momentum behind the broader market.
That does not mean the market has to keep moving higher in a straight line. But it does show that buyers remain in control for now.
As long as the broader trend remains bullish, traders should respect the strength of the move.
However, respecting the trend is not the same as blindly chasing it.
RSI Is Getting Stretched
One of the key warning signs right now is the Relative Strength Index, better known as RSI.
RSI is a momentum indicator that helps traders measure whether a market may be getting overbought or oversold. When RSI pushes toward elevated levels, it can suggest that price momentum has become stretched in the short term.
That is where SPY appears to be heading now.
With SPY nearing overbought RSI levels, traders may want to be careful about chasing extended moves after a strong rally.
Overbought does not automatically mean the market has to fall. Strong markets can remain overbought longer than many traders expect.
But it does mean the risk of a short-term pullback or pause may be increasing.
Monthly RSI Divergence Still Flashes Caution
Another important chart signal is the ongoing monthly RSI divergence.
This type of divergence can occur when price continues making new highs while momentum fails to confirm those highs with the same strength.
In simple terms, the market may be moving higher, but the underlying momentum may not be as strong as price alone suggests.
That does not guarantee an immediate reversal. But it is a caution signal, especially as the market approaches the end of the month.
Monthly chart signals tend to carry more weight than short-term signals because they reflect a broader market picture. When a monthly RSI divergence remains in place, traders should pay attention.
Don’t Chase. Manage Risk.
The biggest takeaway for traders is simple:
The trend is bullish, but risk management still matters.
New highs can create excitement. They can also tempt traders to chase late-stage moves after much of the upside has already happened.
That is where discipline becomes important.
Traders may want to watch for:
- Pullbacks into support
- RSI cooling off from elevated levels
- Strong volume confirmation
- Whether buyers continue stepping in on weakness
- Any signs that momentum is beginning to fade
In a strong market, pullbacks can create opportunity. But chasing overextended moves can increase risk.
Bottom Line
The SPY new high is an encouraging sign for the bulls, especially as investors react positively to the possibility of an extended U.S.-Iran ceasefire.
But the charts are also sending a message.
With SPY nearing overbought RSI levels and monthly RSI divergence still flashing caution, traders should avoid complacency. The trend remains bullish, but this is still a market that requires discipline, patience, and careful risk management.
New highs are exciting.
But smart traders know the chart still matters.
Risk Disclosure: Trading stocks, ETFs, and options involves substantial risk and is not suitable for all investors. Past performance is not indicative of future results. This article is for educational and informational purposes only and should not be considered investment advice or a recommendation to buy or sell any security.