

Have you ever watched a stock fall to a certain price, bounce, and then do almost the exact same thing again days or weeks later?
Or maybe you’ve seen a stock rally repeatedly toward the same level—only to turn lower each time.
Those areas are often referred to as support and resistance, and they’re among the most basic concepts traders use when analyzing price charts.
But why do certain price levels matter?
The answer has less to do with mysterious lines on a chart and more to do with the behavior of buyers and sellers.
What Is Support?
Support is an area where buying has previously been strong enough to slow or stop a decline.
Imagine a stock falls from $60 to $50 and buyers aggressively step in. The stock eventually rallies back to $60.
Several weeks later, it falls toward $50 again.
Traders who remember the previous bounce may view $50 as an attractive price. Previous buyers may add to positions, while other investors who missed the first opportunity may decide to buy.
That additional demand can create support.
What Is Resistance?
Resistance works in the opposite direction.
It’s an area where selling has previously been strong enough to slow or stop an advance.
Suppose that same stock repeatedly rallies toward $60 but struggles to move higher.
Some investors may decide to take profits near $60. Traders who previously bought at that level and watched the stock fall may also be eager to sell if they can finally get back to their original purchase price.
That additional supply can create resistance.
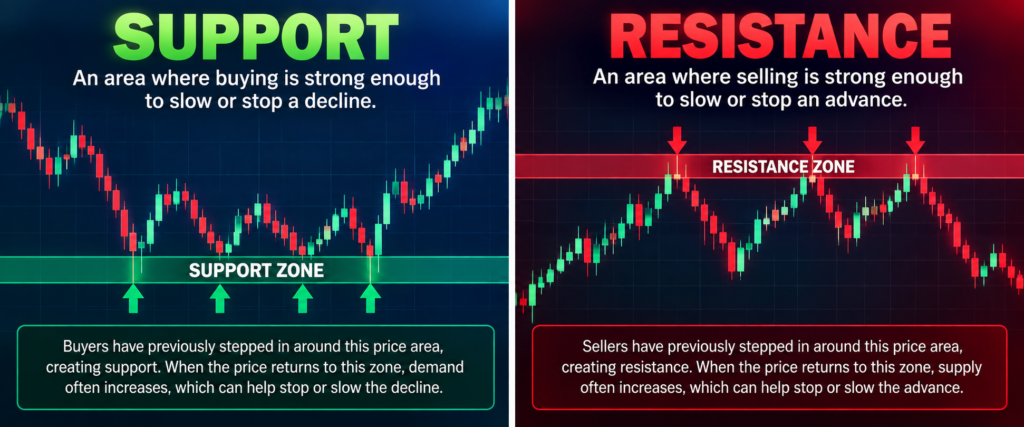
Think in Zones, Not Exact Prices
One common mistake is treating support and resistance as exact numbers.
Markets aren’t usually that precise.
A stock with support near $50 might reverse at $49.75 one day and $50.40 another.
That’s why many traders think of support and resistance as zones rather than exact lines.
The more often price reacts around an area, the more attention traders may begin paying to it.
When Support and Resistance Break
Support and resistance don’t last forever.
Eventually, buyers or sellers may become strong enough to push price through an established level.
This can create an interesting change in market psychology.
Old resistance can sometimes become new support.
If a stock repeatedly struggles to move above $60 and eventually breaks through it, traders may begin looking for buyers to appear if the stock later pulls back toward $60.
The opposite can happen when support breaks.
Old support can become new resistance.
A Breakout Isn’t a Guarantee
Just because price moves through resistance doesn’t mean it will continue higher.
Markets frequently experience false breakouts, where price briefly moves beyond an important level before reversing.
That’s why traders may look for additional confirmation through factors such as volume, momentum, market conditions, or the way price behaves after the breakout.
No single technical level can predict what the market will do next.
Why Support and Resistance Matter
Support and resistance can help traders identify areas where the balance between buyers and sellers may change.
They can also help with planning.
Before entering a trade, a trader might ask:
Where is the nearest support?
Where is resistance?
Where would my original trading idea no longer make sense?
Is there enough potential reward relative to the risk?
Those questions turn support and resistance from simple lines on a chart into part of a broader trading and risk-management process.
The Trading Takeaway
Support and resistance aren’t magical price levels.
They represent areas where buyers and sellers have previously shown that they’re willing to act.
Understanding those areas can help traders put current price action into context—but they should never be used in isolation.
Look at the broader trend, volume, volatility and market environment as well.
Most importantly, remember:
A price level tells you where to pay attention. Price action tells you what happens when the market gets there.