
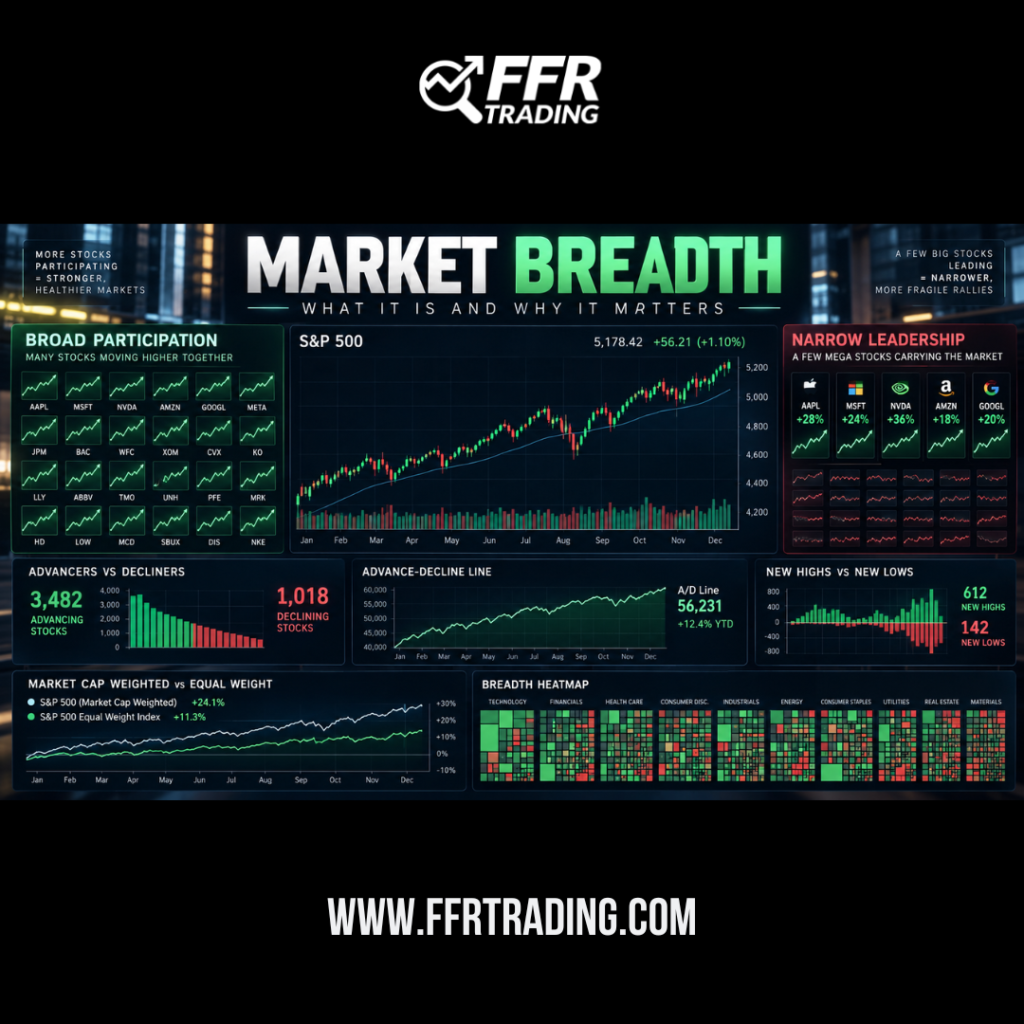
Market breadth helps traders measure how many stocks are participating in a market move. It can reveal whether a rally is supported by a wide range of stocks or driven by only a handful of large companies.
What Is Market Breadth?
Market breadth measures how many individual stocks are participating in a market move.
In simple terms, it answers an important question:
Is the market rising because most stocks are strong, or because only a few large stocks are carrying the indexes?
Strong participation usually means a larger percentage of stocks are moving in the same direction. Weak participation can indicate that leadership is becoming increasingly concentrated.
Why Does Market Breadth Matter?
Breadth indicators help traders look beneath the surface of the major indexes.
For example, the S&P 500 could be making new highs even while hundreds of individual stocks are declining.
That happens because the S&P 500 is weighted by market capitalization. The largest companies have a much greater effect on the index.
As a result, a small group of mega-cap stocks can sometimes keep the S&P 500 moving higher even when the average stock is struggling.
This does not necessarily mean the market is about to decline. However, narrowing participation can tell traders that fewer stocks are supporting the advance.
Common Market Breadth Indicators
Traders can measure participation in several ways.
Advance-Decline Line
The Advance-Decline Line, or A/D Line, compares the number of stocks rising with the number falling.
When more stocks advance, the indicator tends to rise. When declining stocks dominate, it tends to fall.
The A/D Line can help traders determine whether broad participation is confirming the direction of the major indexes.
New Highs vs. New Lows
Another useful indicator compares the number of stocks reaching new highs with those making new lows.
If new highs are expanding, participation may be improving.
However, if new lows begin outnumbering new highs while the indexes remain near records, leadership may be narrowing.
Equal-Weight Indexes
Equal-weight indexes provide another useful perspective.
Unlike the traditional S&P 500, an equal-weight version gives every company roughly the same influence.
If the regular S&P 500 is rising while the equal-weight index falls, that may indicate that a relatively small number of large stocks are driving the market.
Strong Breadth vs. Weak Breadth
Strong participation often includes:
- More advancing stocks than declining stocks
- An improving Advance-Decline Line
- An increasing number of new highs
- Strength in equal-weight indexes
Weak participation can include:
- More declining stocks
- An increasing number of new lows
- Weak equal-weight indexes
- Major indexes relying heavily on a few large companies
Can Weak Breadth Predict a Market Decline?
Not by itself.
Weak participation can continue for weeks or even months while the major indexes keep rising.
For that reason, traders generally should not treat market breadth as a stand-alone buy or sell signal.
Instead, it can provide additional context.
If prices remain strong while participation deteriorates, the market may become increasingly dependent on its largest leaders.
That becomes more important if those stocks begin losing momentum.
How Traders Can Use Market Breadth
Traders can use market breadth to confirm or question what they see in the major indexes.
For example, if the S&P 500 reaches a new high while participation also improves, the advance has broader support.
However, if the index reaches new highs while fewer stocks participate, traders may want to watch conditions more closely.
The goal is not to predict the exact top or bottom.
Instead, breadth indicators help traders judge the quality and participation behind a market move.
The Bottom Line
Market breadth gives traders a clearer view of what is happening beneath the major indexes.
Strong participation suggests that many stocks are supporting the move. Weak participation suggests that leadership is becoming more concentrated.
Combined with price action, support and resistance, volume, and trend analysis, breadth can provide valuable context about overall market strength.
Sometimes the index tells you where the market is going.
Breadth helps show how many stocks are going along for the ride.