
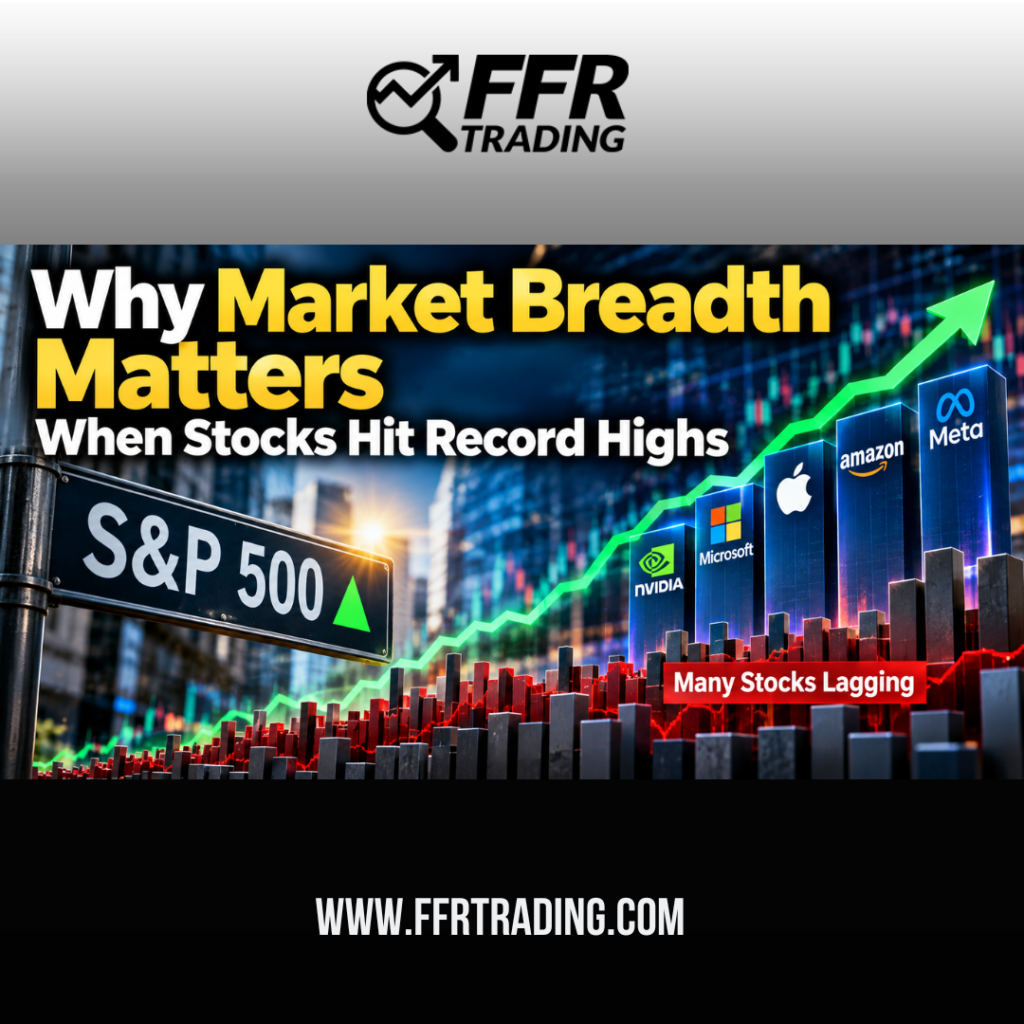
A Record High Doesn’t Tell the Whole Story
When the S&P 500 reaches a new all-time high, it’s easy to assume the entire stock market is performing well.
But that isn’t always the case.
Major indexes such as the S&P 500 are market-cap weighted. That means the largest companies have a much greater influence on the index than smaller companies.
As a result, a relatively small group of mega-cap stocks can sometimes push the S&P 500 higher—even while hundreds of other stocks lag behind.
That’s where market breadth becomes useful.
What Is Market Breadth?
Market breadth measures how many stocks are actually participating in a market move.
Think of it as looking beneath the hood of an index.
If the S&P 500 is rising and most stocks are also advancing, the rally has broad participation.
If the index is rising while only a handful of large stocks are moving higher, participation is narrow.
Neither condition automatically tells you the market is about to rise or fall. But the difference can provide valuable information about the strength of a move.
Why Narrow Leadership Matters
Imagine the S&P 500 contains 500 stocks, but most of the gains are being generated by a small group of Technology and Semiconductor companies.
The index could look extremely strong.
Yet beneath the surface, many stocks might be flat or declining.
That creates a market that depends heavily on its biggest leaders.
As long as those stocks continue climbing, the indexes can keep advancing. But if those leaders begin to weaken, there may be fewer stocks available to pick up the slack.
That can make the broader market more vulnerable to a pullback.
Three Ways Traders Can Watch Breadth
One of the simplest methods is comparing the market-cap-weighted S&P 500 with the equal-weight S&P 500. If the traditional index is dramatically outperforming its equal-weight counterpart, large companies may be responsible for much of the market’s strength.
Traders can also watch the number of advancing versus declining stocks and the percentage of stocks trading above important moving averages such as the 50-day or 200-day average.
These indicators can help answer an important question:
Is the market moving together—or are a few stocks doing most of the work?
Narrow Breadth Isn’t Automatically Bearish
This is an important distinction.
Narrow leadership does not mean a market decline is imminent.
Strong market leaders can continue leading for extended periods. Sometimes the rest of the market eventually catches up, creating an even broader advance.
That would generally be a constructive development.
The warning sign comes when the leading stocks begin weakening without broader participation improving.
That combination can indicate that momentum beneath the major indexes is deteriorating.
💡 FFR Trader’s Tip
Don’t judge the health of the market solely by where the S&P 500 or Nasdaq closes.
Ask two questions:
Is the index moving higher?
How many stocks are helping it get there?
Price tells you the market’s direction. Breadth can help tell you the quality of the move.
The Bottom Line
Record highs are bullish evidence—but they’re only part of the picture.
When an index reaches new highs, take a few minutes to examine what’s happening underneath it.
If participation expands, the rally may be gaining strength.
If leadership continues narrowing, traders may want to become more selective and pay closer attention to the stocks carrying the market.
Sometimes the most important information isn’t in the index itself—it’s in the stocks behind it.