
It’s no question that we’re currently living in a volatile market. Stocks are moving fast, and everybody is looking for a way to reliably predict which direction price action will move next. Often, the everyday trader scours the internet looking for the next best indicator to make those predictions. Little do they know, though, that the answer isn’t always some fancy indicator, but instead just simple manual analysis.
Since the beginning of stock analyzing, traders have been using support and resistance areas as key indicators on determining when a market is going to be strong, and when it’s going to be weak. Many indicators have had trouble standing against the test of time due to the market’s climate change. The simple analysis of support and resistance, however, has remained unchanged in its usefulness.
Today, we are going to show you a few examples of this strategy working in REAL TIME on a stock that was ACTUALLY TRADED on a live portfolio. In this introduction, we will show you how to begin using this strategy that you will someday be able to master after actively practicing it on your portfolio.
To begin, we’ll start with the simple definitions of support and resistance areas. Support areas are essentially points where a stock that has been following a steady downtrend for some time will find a pause in that negative energy. In contrast, resistance areas work in the opposite sense, where a stock that has been bullish for quite some time will find its energy being challenged.
Below, you will find a daily chart of Micron Technology (MU) displaying an example of resistance areas perfectly.
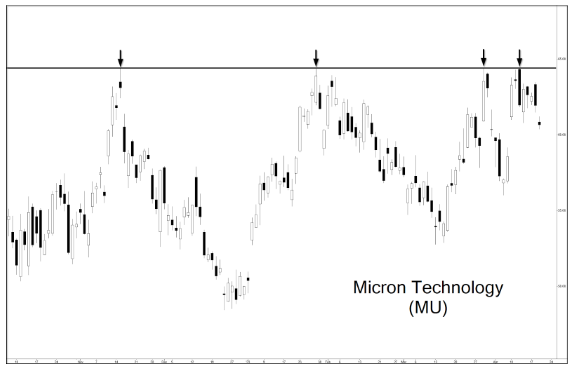
Here’s a quick rundown of what’s happening here: The first black arrow on the far-left side of the chart shows a swing high followed by a strong bearish period for MU. After establishing a swing low, MU proceeded to enter a bullish period for some time before reaching the previously mentioned swing high once again. After reaching this area, you can see that it had bounced off the previous swing high perfectly before repeating this pattern. After a few repeats, it had become overwhelmingly evident that MU did NOT want to trade above this area as shown by the horizontal line. This was a clear indicator that if it had reached this area again, investing in Puts would be a safe bet.
Moving forward, below shows an example of a support area on a daily chart of Synchrony Financial (SYF).
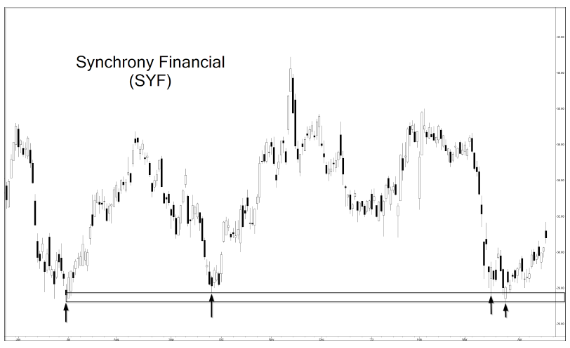
Here, you can see that this is clearly more of an “area” or “range” than a defined point like the previous MU example. This goes to show that these areas do not always need to be exact. If you find a stock that is showing signs of responding to a range, then this strategy could be applied to said stock.
To give a quick explanation of what’s happening here, SYF had begun to show strength upon reaching the range displayed on the rectangle above. As you can see, every time it reached this area, SYF received a lifeline after a strong retracement. After the 2nd response shown by the 2nd vertical arrow above. SYF had been placed on our watch list to see if a 3rd response could be generated. Later, this said response was confirmed which prompted a recommendation to buy call options that profited generously within only a few days.
As said before, many traders are always looking for the fanciest indicator that they can put onto their charts. Often, these indicators require extensive research to understand, and a lot of practice to master. What many of these traders don’t know, though, is that sometimes the simplest answer is the best. Although this strategy isn’t flashy or complicated, the simplicity of it is what causes many traders to use it to their advantage, which is why these markets respond the way they do to it. Hopefully, these examples provided some insight into how effective this strategy can be if used properly.
Contact FFR Trading today for additional guidance for your trading portfolio.